I was listening to a podcast recently with Ray Dalio, founder of Bridgewater Associates, one of the largest and most successful hedge funds in the world. A theme Dalio returned to several times was the idea that it is to take the entirety of market history – and not just the timeframe in which you’re investing – to determine what might come next. Just because something hasn’t happened in the years or decades in which you’ve invested doesn’t mean it won’t or can’t happen.
The San Francisco Fed recently released a paper – The Rate of Return on Everything, 1870-2016 that is a boon to those that want to study market history. The paper examined returns on bonds, stocks and real estate for 16 countries for over 150 years. Aside from the long timeframe involved, another unique aspect of the market history study was the inclusion of real estate in the study as determining return on real estate (and this paper looks specifically at rental real estate) has been notoriously difficult.
The paper is over 120 pages long, so it contains a good deal of information. However, on the initial reading, there are a couple of points that were particularly interesting for investors. They are as follows:
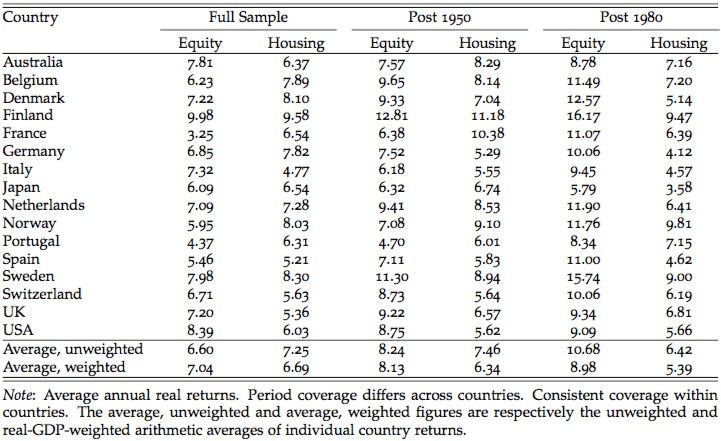
Where you invest matters – rates of return differed a good deal by asset type and by country. Adjusting for risk, investors in equities in the U.S. and Australia have done extremely well. Investors in Portugal and Germany were on the other end of the scale, and the paper’s authors posit that political upheaval reduces returns on equity.
Returns on rental real estate are surprisingly high – there haven’t been many studies done on historical returns on residential real estate due to the difficulty of finding data to calculate return. Robert Schiller, co-create of the Case Schiller index that tracks home prices since 1890 has described housing as a poor investment, greatly underperforming the stock market. This particular study found a very different result – housing returns were on par with stocks in most markets, and importantly, volatility of housing returns were much lower. Given that this result was such an anomaly versus other studies, more research will undoubtedly be done to confirm the accuracy of the results.
Volatility is important to investors – when considering the return of an investment, the arithmetic mean, or average, is often quoted. However, as an investor, what you actually earn on any investment for which return is compounded is the geometric mean. The difference between the two is volatility, or more specifically standard deviation and the geometric mean is just the arithmetic mean less one-half the standard deviation. This article provides a bit more information on the difference between the two means, and the chart below shows how much less volatile real estate returns were found to be and how that led to a higher geometric return for real estate.
The composition of the return has important tax implications – most stocks and all bonds and rental real estate provide two sources of return – income in the form of interest, dividends or rent, and gain in the value of the asset. In the U.S., the different types of income are typically taxed at different rates and what is key to you as an investor is your after tax return. Your specific tax situation will dictate the specific rates you pay, and what may be an attractive investment to some might not be an attractive investment for you based on the after tax return. The key is to understand the composition of the return and how you will be taxed. One final note – taxation of real estate in the U.S. is particularly complex, so it is key to understand the particular investment if you are considering investing in real estate.
As an investor, it is easy to get overwhelmed by the day-to-day noise of the financial press and the strident predictions pundits make to get your attention. Taking a step back and reading through a paper like this one on market history is helpful in examining your assumptions and assessing where and how you have chosen to invest.


